Re: Indian Economy News & Discussion - Nov 27 2017
Posted: 21 Mar 2019 10:35
Deleted
Consortium of Indian Defence Websites
https://forums.bharat-rakshak.com/
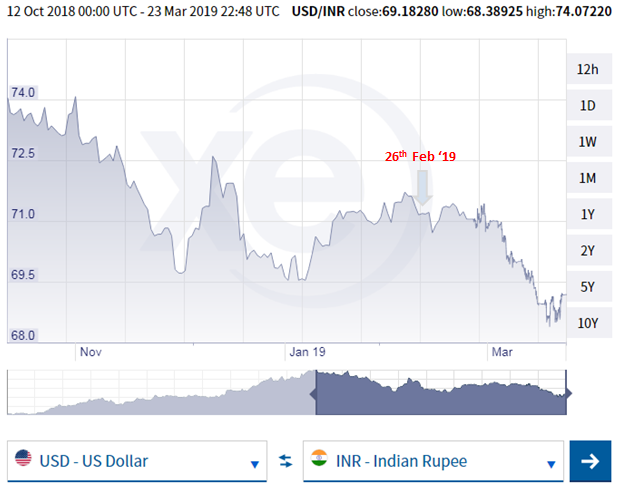
The price of oil and its import is a big driver here. More offshore oil exploration has to be explored to get oil domestically.SaiK wrote:Marc Faber is wrong. 2028 or 2038 or later, the rupee is unlikely to ever hit 100
Some of the reasons why this may not happen, include the new 4% inflation target and India's rapid growth.
https://www.moneycontrol.com/news/busin ... 01141.html
he government on Friday said that it has exceeded the divestment target for FY19 by Rs 5,000 crore as the receipts have touched projected Rs 85,000 crore. “As against a target of Rs 80,000 crore for disinvestment for the current year, the divestment receipts have touched Rs 85,000 crores today,” Finance Minister Arun Jaitley tweeted.
The Modi government had fixed the divestment target of Rs 90,000 crore for FY20. In FY18, the government earned Rs 1,00,056.91 crore from disinvestment against a target of Rs 72,500 crore.
.....................
Some good news on Fiscal deficit front!Uttam wrote:Modi govt exceeds disinvestment target for FY19 as receipts hit Rs 85,000 crorehe government on Friday said that it has exceeded the divestment target for FY19 by Rs 5,000 crore as the receipts have touched projected Rs 85,000 crore. “As against a target of Rs 80,000 crore for disinvestment for the current year, the divestment receipts have touched Rs 85,000 crores today,” Finance Minister Arun Jaitley tweeted.
The Modi government had fixed the divestment target of Rs 90,000 crore for FY20. In FY18, the government earned Rs 1,00,056.91 crore from disinvestment against a target of Rs 72,500 crore.
.....................

Cold storage capacity expands, Rs 21,000 crore investment lined up by 2023Giving relief to exporters, the government has extended IGST (Integrated Goods and Service Tax) and compensation cess exemptions for goods procurement under certain export promotion schemes till March 2020.
These exemptions have been extended for exporters buying inputs domestically or importing for export purposes under export oriented unit (EOU) scheme, Export Promotion Capital Goods (EPCG) scheme and advance authorisation.
EPCG is an export promotion scheme under which an exporter can import certain amount of capital goods at zero duty for upgrading technology related with exports.
On the other hand, advance authorisation is issued to allow duty free import of inputs, which is physically incorporated in export product.
The move was aimed at giving relief to exporters as they do not have to pay IGST at the initial point itself. In the GST regime, they have to pay the indirect tax and then seek refund, which is a cumbersome process.
2018 GCCA Global Cold StorageIn next 4-5 years Rs 21,000 crore will be invested in setting up or upgrading cold storages to address the problem of stockpiling of perishable commodities. There has been an urgent need to upgrade existing cold storage plant and machinery, and technology. An under-developed food processing value chain is another issue that needs to be resolved.
Currently 68 per cent of the existing cold storage capacity is used for storing potato and yet farmers are not getting the right price. The situation in other commodities no better.
Crisil Research has estimated that investment of Rs 16,000-21,000 crore is being lined up in the sector between 2019 and 2023 for optimising the domestic post-harvest value chain and to feed the downstream food processing industry.
According to Crisil Research director Hetal Gandhi, fresh investment was expected from private players, while the government typically supported the sector through subsidies. For instance, the union ministry of food processing offered subsidy at 50 per cent of the project cost with a cap of Rs 10 crore.
To set up a multi-commodity cold storage of 10,000 tonnes capacity, investment of around Rs 20 crore is needed with a payback period of 6-7 years.
Undoubtedly, cold storage forms the most vital post-harvest horticultural value chain for the downstream food processing industry. The current cold storage capacity in India is pegged at 37-39 million tonnes (MT). According to official statistics, there are about 7,645 cold storages in the country with 68 per cent of the capacity being used for potato, while 30 per cent is multi-commodity cold storage.
India generated record number of jobs in January 2019, shows EPFO dataIndia has reported 150 million cubic meters of refrigerated warehousing in 2018, maintaining the position
of the largest total capacity among the countries in the GCCA database. India had 7,645 cold storages in
2018, each averaging less than 20,000 cubic meters in size. Nearly all of the cold storage facilities were
owned by private sector companies and the products stored were mainly potatoes and other vegetables.
The United States, with 131 million cubic meters of refrigerated warehouse capacity, was ranked second
behind India. Refrigerated facilities in the United States averaged approximately 113,000 cubic meters
each.
China was the third-ranked country market in 2018, at 105 million cubic meters. After several years of
rapid expansion, growth in the Chinese refrigerated warehouse industry has leveled off, according to
industry sources.

Exclude on what basis ?hgupta wrote:Can we exclude import of petroleum and raw energy products such as coal from merchandise imports or have they already been excluded?
Basis of manufactured goods and the fact that India's economy is not merely providing raw materials but manufactured goods and India is not a large oil producing nation. If we can see that India is exporting more manufactured goods than importing, it shows that India's economy is becoming well diversified and technology advanced enough to meet at least over 80% of its manufactured good needs. Exclusion of the petroleum and coal raw materials allow us to see that.Suraj wrote:Exclude on what basis ?hgupta wrote:Can we exclude import of petroleum and raw energy products such as coal from merchandise imports or have they already been excluded?
Why would monthly PIB data need to do that ? They just report topline data. Sounds like an exercise for someone interested in finding these out - go ahead and find out yourself.hgupta wrote:Basis of manufactured goods and the fact that India's economy is not merely providing raw materials but manufactured goods and India is not a large oil producing nation. If we can see that India is exporting more manufactured goods than importing, it shows that India's economy is becoming well diversified and technology advanced enough to meet at least over 80% of its manufactured good needs. Exclusion of the petroleum and coal raw materials allow us to see that.
Hence my question whether the petroleum products were excluded or not. I didn't ask for the data. Just whether it was excluded or not. If they were not, I will find out out myself.Suraj wrote:Why would monthly PIB data need to do that ? They just report topline data. Sounds like an exercise for someone interested in finding these out - go ahead and find out yourself.hgupta wrote:Basis of manufactured goods and the fact that India's economy is not merely providing raw materials but manufactured goods and India is not a large oil producing nation. If we can see that India is exporting more manufactured goods than importing, it shows that India's economy is becoming well diversified and technology advanced enough to meet at least over 80% of its manufactured good needs. Exclusion of the petroleum and coal raw materials allow us to see that.
You're asking for post-processed data excluding some components that interest you specifically. Standard trade data reports all merchandise. Why is that hard to understand ?hgupta wrote:Hence my question whether the petroleum products were excluded or not. I didn't ask for the data. Just whether it was excluded or not. If they were not, I will find out out myself.Suraj wrote: Why would monthly PIB data need to do that ? They just report topline data. Sounds like an exercise for someone interested in finding these out - go ahead and find out yourself.
No some datasets exclude petroleum imports as they are not considered merchandise but raw materials because they skew the overall manufacturing picture of a country's economy. Hence the request for clarification.Suraj wrote:You're asking for post-processed data excluding some components that interest you specifically. Standard trade data reports all merchandise. Why is that hard to understand ?hgupta wrote:
Hence my question whether the petroleum products were excluded or not. I didn't ask for the data. Just whether it was excluded or not. If they were not, I will find out out myself.
The data reported above is trade data and not manufacturing data.hgupta wrote:No some datasets exclude petroleum imports as they are not considered merchandise but raw materials because they skew the overall manufacturing picture of a country's economy. Hence the request for clarification.
No but relying only on one piece of data doesn't paint a overall comprehensive picture of the logistics chain. It skews the picture. As for US extensively obtaining produce that is prior to full ripeness and sell it to customers while ripe, this indicates the efficiency of its logistics chain especially the JIT component whether you like it or not. Look at the length of time it takes to load and unload produce at a port and transport it halfway through the country to its distribution centers to the end stores in the US and Europe. Compare that to China and India and you would see that India has a long way to go.Suraj wrote:There's nothing to 'be fooled by' in cold storage statistics. It's a piece of data, that is all. JIT requires greater and more expensive logistics infrastructure, and does not necessarily indicate a better system. The US also extensively obtains produce that is prior to full ripeness and artificially enhances ripeness prior to end customer stocking, and otherwise processes foods to an extent far beyond what happens in India .
You're going off on a tangent here. My point is simple - the monthly data reported is aggregate data. It always has been . Your own topic of interest is a completely separate matter. If you need the data for it, it's up to you to parse the raw data and find out what you need .hgupta wrote:Yes but trade data cannot indicate strength of manufacturing prowess of a country without separating raw energy materials such as petroleum. If a country export more manufactured goods than import manufacturing goods, it indicates stronger manufacturing base. If it imports more, it indicates that its manufacturing base is underdeveloped. So it helps if we can separate the petroleum imports from the trade data and determine where India's manufacturing prowess lie. It is also useful for determining the nation's economic policies wrt securing its own energy supply. If India can reduce its petroleum imports and reduce the deficit at the same time, it means that India should focus more on reducing its need for foreign oil and develop its internal energy supply whether through natural gas fields or renewable energy sectors.
Please don't derail this thread by starting commentary with strawmen like this. You're new here, so you're offered some latitude, but any further thread derailment will result in a warning or ban.hgupta wrote:No but relying only on one piece of data.
https://swarajyamag.com/insta/delhis-ig ... third-spotDelhi’s IGI Airport Now Twelfth Busiest Globally, As Indian Aviation Market Rises To Third Spot
Delhi’s IGI Airport Now Twelfth Busiest Globally, As Indian Aviation Market Rises To Third Spot
The preliminary world airport traffic rankings for the year 2018, prepared by the Airport Council International (ACI), have seen New Delhi’s Indira Gandhi International Airport (IGI) jump four ranks from last year to become the world’s twelfth busiest airport, reports The Economic Times.
In the latest rankings, it has overtaken major international air travel hubs such as Frankfurt, Dallas Fort Worth, Guangzhou and Istanbul’s Atatürk airports.
Moreover, the report shows that among the top 20 airports of the world, IGI has been the fastest growing in 2018, with the airport seeing 69 million domestic and international flyers in the year, up 10.2 per cent from the previous year.
Four airports which are just ahead of IGI in the rankings could have been overtaken in 2018 itself if the infrastructure expansion of the airport had not been unduly delayed, meaning that the airport could’ve already cracked the top 10.
Also, India is now the world’s third largest aviation market, and is still witnessing rapid growth.
“India became the world’s third-largest aviation market in terms of passenger throughput, behind the US and China, in 2018. India’s move towards a more liberalised aviation market and the nation’s strengthening economic fundamentals have helped it become one of the fastest-growing markets with its traffic growing rapidly in a relatively short time,” a statement from ACI said.
I am not surprised by your reaction or your post. Going through this thread and reading all the posts has illuminated on how you have approached other people's opinions that differ from your opinions and basically turned this thread about your economic opinions and arguments and basically threaten to warn or ban anyone who dare to challenge your conventional thinking and browbeat the posters to agree to your groupthink. It is very easy to be dismissive of other opinions and call them strawman arguments or decrying derailment. Why don't you relabel this thread as Suraj's Economic Theories thread since this has what basically become.Suraj wrote:Please don't derail this thread by starting commentary with strawmen like this. You're new here, so you're offered some latitude, but any further thread derailment will result in a warning or ban.hgupta wrote:No but relying only on one piece of data.
In next 4-5 years Rs 21,000 crore will be invested in setting up or upgrading cold storages to address the problem of stockpiling of perishable commodities. There has been an urgent need to upgrade existing cold storage plant and machinery, and technology. An under-developed food processing value chain is another issue that needs to be resolved.
Currently 68 per cent of the existing cold storage capacity is used for storing potato and yet farmers are not getting the right price. The situation in other commodities no better.
Crisil Research has estimated that investment of Rs 16,000-21,000 crore is being lined up in the sector between 2019 and 2023 for optimising the domestic post-harvest value chain and to feed the downstream food processing industry.
Undoubtedly, cold storage forms the most vital post-harvest horticultural value chain for the downstream food processing industry. The current cold storage capacity in India is pegged at 37-39 million tonnes (MT). According to official statistics, there are about 7,645 cold storages in the country with 68 per cent of the capacity being used for potato, while 30 per cent is multi-commodity cold storage.
Top potato producers of Uttar Pradesh and West Bengal make up 55-60 per cent of the overall domestic cold storage capacity.
hgupta wrote:Yes but trade data cannot indicate strength of manufacturing prowess of a country without separating raw energy materials such as petroleum. If a country export more manufactured goods than import manufacturing goods, it indicates stronger manufacturing base. If it imports more, it indicates that its manufacturing base is underdeveloped. So it helps if we can separate the petroleum imports from the trade data and determine where India's manufacturing prowess lie. It is also useful for determining the nation's economic policies wrt securing its own energy supply. If India can reduce its petroleum imports and reduce the deficit at the same time, it means that India should focus more on reducing its need for foreign oil and develop its internal energy supply whether through natural gas fields or renewable energy sectors.
1. India is one of largest importers of crude oil but it is also one of the largest exporters of refined oil given the presence of refineries to take advantage of country's location between crude oil producing nations in the Middle East and its consumers in the rest of Asia.
2. Refined Petroleum is the among the top two exports of India. Our country is the 10th largest exporter of refined petroleum in the world. India exports refined petroleum to the USA, UK, Australia as well as oil-producing countries like Iraq and UAE. During 2017, India exported refined oil worth $24.1 billion. Its share in the world market stood at 3.9%.
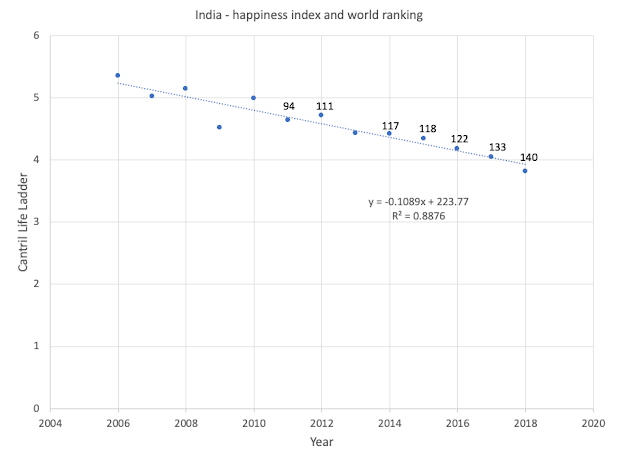
It would seem that India's discontent has been steadily increasing. If it is not bad data, I just hope that this is a reflection of Indians' rising aspirations.“Please imagine a ladder, with steps numbered from 0 at the bottom to 10 at the top. The top of the ladder represents the best possible life for you and the bottom of the ladder represents the worst possible life for you. On which step of the ladder would you say you personally feel you stand at this time?”
Code: Select all
Country name	Year	Life Ladder	Log GDP per capita	Social support	Healthy life expectancy at birth	Freedom to make life choices	Generosity	Perceptions of corruption	Positive affect	Negative affect	Confidence in national government	Democratic Quality	Delivery Quality	Standard deviation of ladder by country-year	Standard deviation/Mean of ladder by country-year
India	2006	5.348258972	8.137375832	0.707318068	55.72000122	0.773737073		0.854811728	0.687016845	0.198601618	0.649276435	-0.313264072	-0.11933206	1.949234843	0.364461571
India	2007	5.02679348	8.21575737	0.568992674	56.13999939	0.728892624	-0.059457768	0.862142861	0.668467879	0.252502203	0.817411602	-0.348923355	-0.121813543	1.623953819	0.323059589
India	2008	5.145833015	8.239232063	0.683593154	56.56000137	0.755839646	-0.080736287	0.891188443	0.674159825	0.259315461	0.616264701	-0.322659373	-0.164945617	1.629505038	0.316664964
India	2009	4.521517754	8.306424141	0.652852058	56.97999954	0.678643644	-0.035369355	0.894611061	0.771342933	0.300621331	0.698452473	-0.44656074	-0.194334954	1.965485215	0.434695899
India	2010	4.989277363	8.390426636	0.604809761	57.40000153	0.783060372	0.047065463	0.862548053	0.696512341	0.266502023	0.667365491	-0.417356074	-0.214537695	1.941854835	0.389205635
India	2011	4.634871483	8.441580772	0.552593112	57.70000076	0.837551653	-0.049686003	0.907793522	0.648167193	0.231594488	0.580353677	-0.445488393	-0.241387933	1.788021326	0.385775805
India	2012	4.720146656	8.482096672	0.510574579	58	0.609320104	0.0552986	0.829614758	0.62873435	0.294841021	0.539206505	-0.444927812	-0.307233006	1.964058876	0.416101247
India	2013	4.427788734	8.531806946	0.552826345	58.29999924	0.740176618	0.07209941	0.832356334	0.679957747	0.330437362	0.532654881	-0.398196995	-0.304233044	2.085907936	0.471094728
India	2014	4.424379349	8.591399193	0.621466637	58.59999847	0.809382915	-0.038100276	0.832141995	0.71102351	0.284582049	0.733619034	-0.292308986	-0.286168903	2.344814062	0.529975832
India	2015	4.342079163	8.65811348	0.61013329	58.90000153	0.777225256	-0.017724538	0.776434958	0.70067668	0.321829438	0.694716752	-0.260329306	-0.175081849	2.102304459	0.48416999
India	2016	4.179177284	8.715342522	0.613529384	59.29999924	0.820068777	0.033954486	0.764722109	0.69450444	0.345681459	0.732104599	-0.256837368	-0.13516134	1.74134922	0.416672736
India	2017	4.046111107	8.768212318	0.606767476	59.70000076	0.88585043	-0.053620495	0.780802786	0.682090998	0.317936778	0.8392784	-0.22030808	-0.099256828	1.65982759	0.410227895
India 2018 3.818068743 8.830280304 0.638051987 60.09999847 0.890443385 0.071806304 0.80526334 0.65728718 0.357458085 0.753280878 2.212352753 0.579442859All the raw data seems to tell me is that people increasingly are getting richer, trust the institutions of the state more, and yet are less happy and more worried, and have less belief in social support. It seems simply related to the state of a nation rapidly growing, with no longer joint family structures supporting people, and everyone intent on getting ahead.Positive affect is defined as the average of three positive affect measures in
GWP: happiness, laugh and enjoyment in the Gallup World Poll waves 3-7.
These measures are the responses to the following three questions, respectively:
2
“Did you experience the following feelings during A LOT OF THE DAY yesterday?
How about Happiness?”, “Did you smile or laugh a lot yesterday?”,
and “Did you experience the following feelings during A LOT OF THE DAY
yesterday? How about Enjoyment?” Waves 3-7 cover years 2008 to 2012 and
a small number of countries in 2013. For waves 1-2 and those from wave 8 on,
positive affect is defined as the average of laugh and enjoyment only, due to the
limited availability of happiness.
• Negative affect is defined as the average of three negative affect measures in
GWP. They are worry, sadness and anger, respectively the responses to “Did
you experience the following feelings during A LOT OF THE DAY yesterday?
How about Worry?”, “Did you experience the following feelings during A LOT
OF THE DAY yesterday? How about Sadness?”, and “Did you experience the
following feelings during A LOT OF THE DAY yesterday? How about Anger?”
is more an effect of aspirations minus achievement. If I hope (or aspire) to have a daily wage job in a war-torn country and bring home poori-bhaji daily without losing my life or limb and achieve it for next 6 months, then of course I am a very happy person. But I aspire for a 5 BHK single family home with a merc and a bmw parked and *no* loans but achieve only 3 BHK single family home with a civic and a corolla and some loan., then of course I am unhappy. In fact my happiness will be lower than the citizen of the war torn country who is simply happy to see himself/herself and his/her family alive!!How happy are you?
ED
Verified account
@dir_ed
6h6 hours ago
More
Proactive steps taken by ED in timely freezing the shares of UBHL held by Vijay Mallya and requesting courts to allow sale of these shares have resulted in realization of NPA of Rs. 1008 crore by consortium of banks led by SBI on 27.03.2019.
Nandakumar already gave a very detailed answer.Gus wrote:suraj
please to explain this for layman. thanks
https://economictimes.indiatimes.com/ma ... 586674.cms
India’s infrastructure output grew at 2.1 percent in February from a year earlier, government data showed on Monday.
During April-February, the output growth rate came in at 4.3 percent from the year-ago period, according to the data.
Infrastructure output, which comprises eight sectors - such as coal, crude oil and electricity - accounts for nearly 40 percent of India’s industrial output.