Re: Indian Economy News & Discussion - Nov 27 2017
Posted: 02 Nov 2021 00:37
Consortium of Indian Defence Websites
https://forums.bharat-rakshak.com/
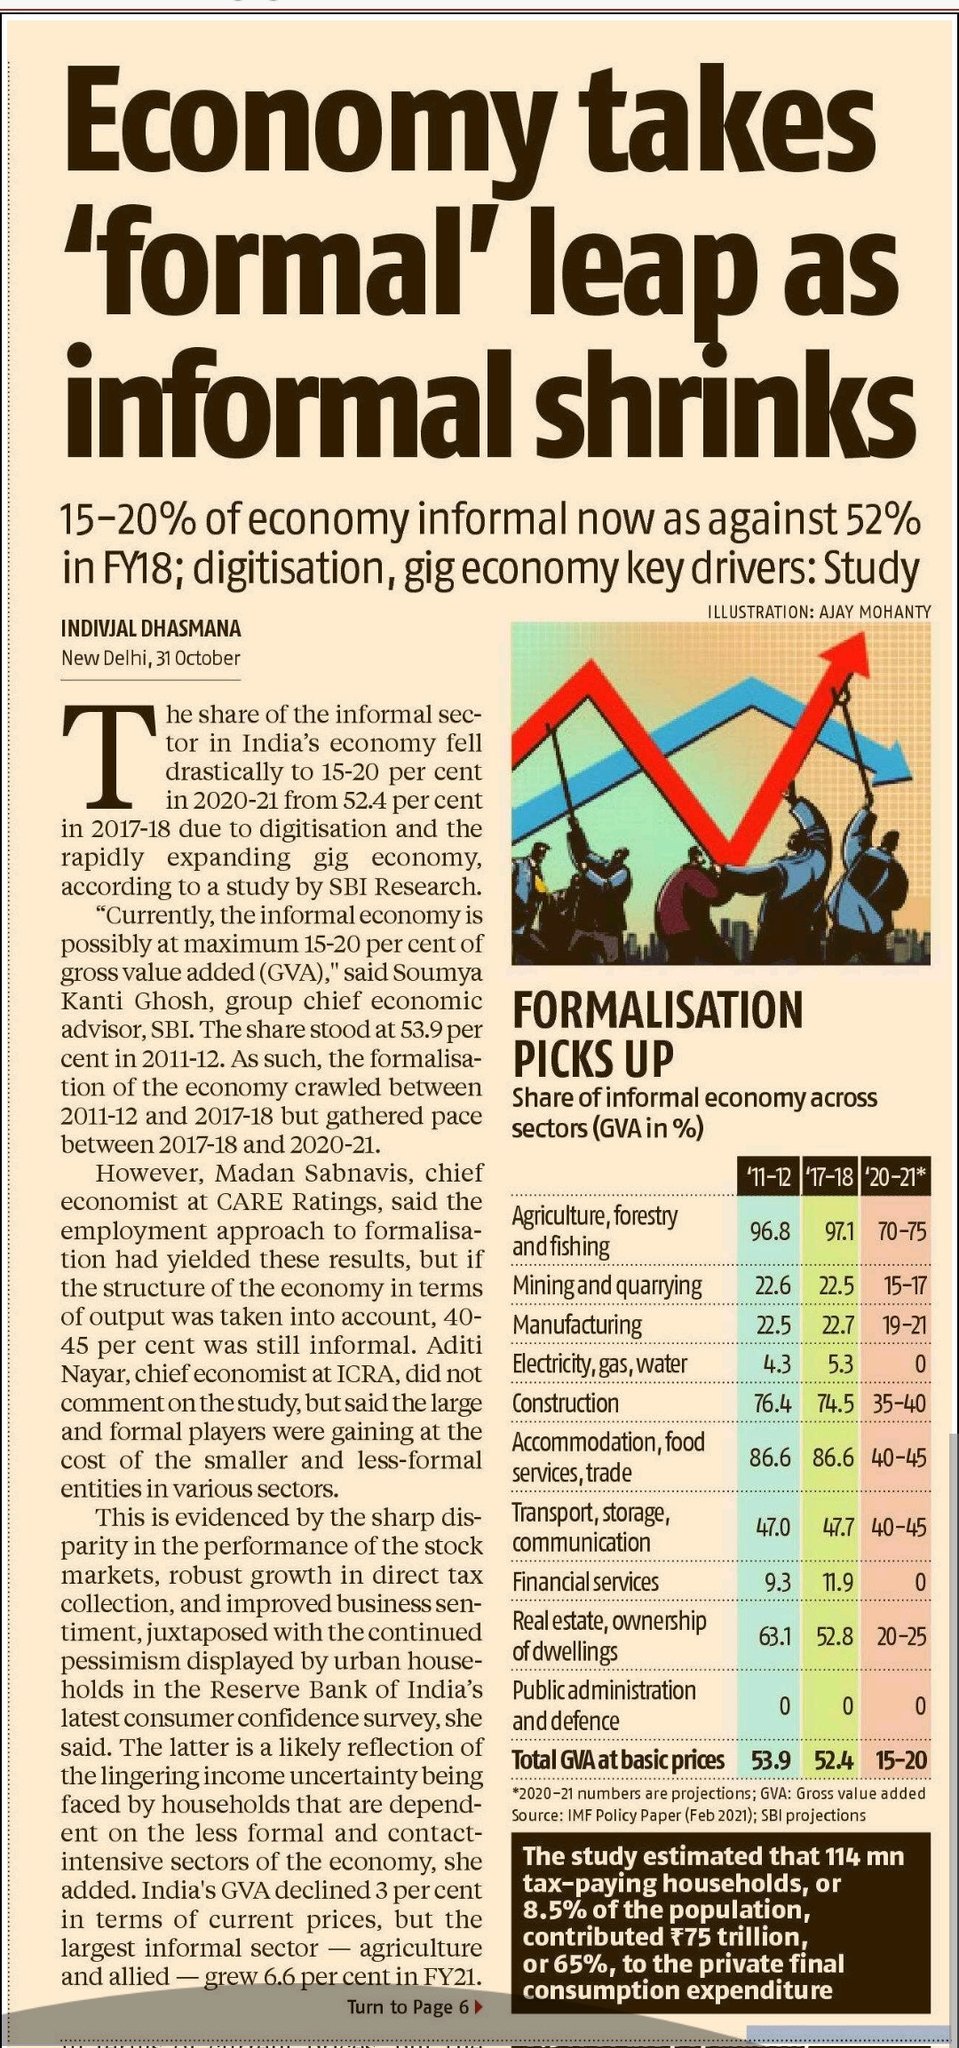
The seasonally-adjusted IHS Markit Purchasing Managers' Index came in at 55.9 in October, rising from 53.7 in September.
New orders also posted an increase in October. In fact, the spike in new orders was quite sharp, the survey shows, and expanded at the fastest rate in seven months. And as such, factory output too saw a sharp recovery & was the increased at the fastest pace since March. "Upbeat business confidence and projects in the pipeline should also support production in the coming months," De Lima added.
UPI hits new record with ₹7.71-lakh crore worth of transactions in October.
E-way bill generation for goods transportation under the goods and services tax (GST) system stood at a record 7.35 crore for October, highest monthly data since the indirect tax regime was rolled out in July 2017, reflecting an upswing in economic activities in the festival season and improved compliance.
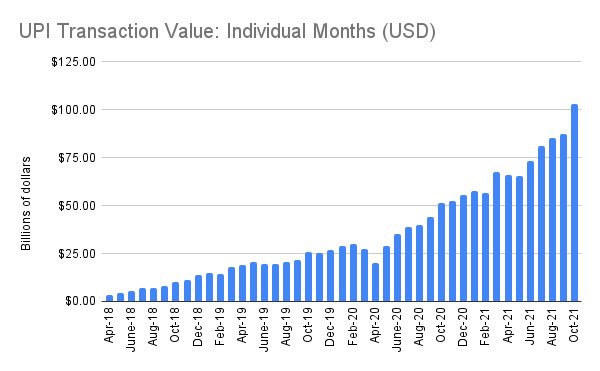
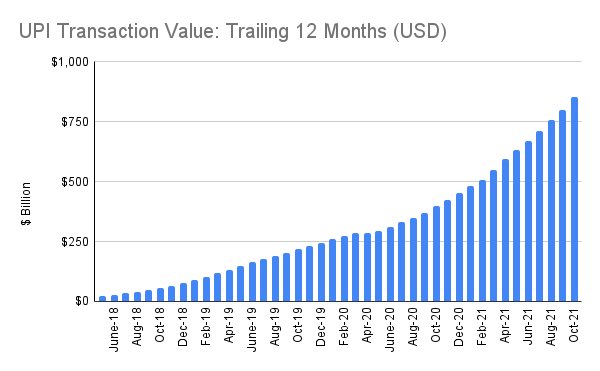
Amidst festival season sales and opening up of the economy, UPI transactions touched a record high at ₹7.71 lakh crore in value terms in October.
This was a new record for UPI, which is fast becoming the most popular choice for digital payments. It was a 56 per cent jump from ₹6.54 lakh crore in transaction value recorded in September.
According to data released by National Payments Corporation of India on Monday, the number of transactions on the Unified Payments Interface platform amounted to 421 crore in October, compared to 365 crore in September.
Daily payments through UPI were averaging between ₹25,000 crore to ₹30,000 crore in October.
The Immediate Payment Service (IMPS) also scaled a new high in October and processed 43.06 crore transactions worth ₹3.7 lakh crore. It had processed 38.48 crore transactions amounting to ₹3.24 lakh crore in September.
Meanwhile, there were 21.42 crore transactions via the NETC FASTags totalling ₹3,356.74 crore in October compared to 19.36 crore transactions worth ₹3,009.3 crore in September.
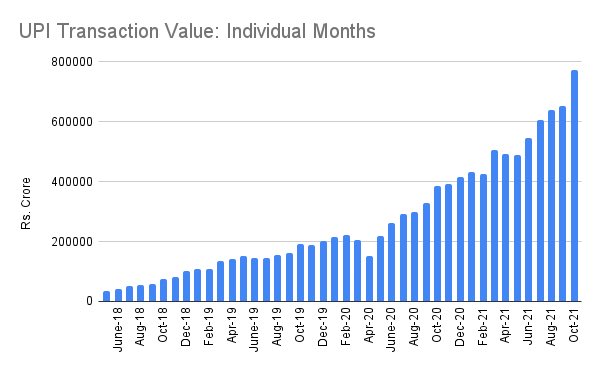
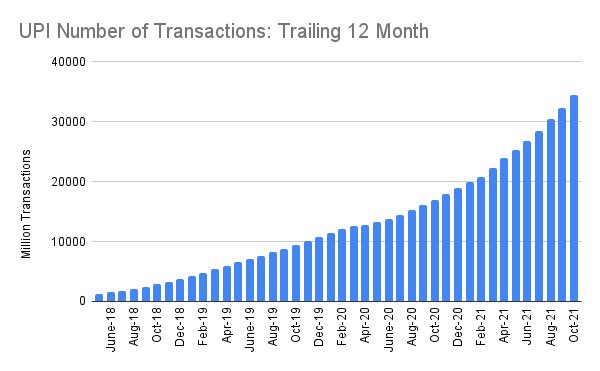
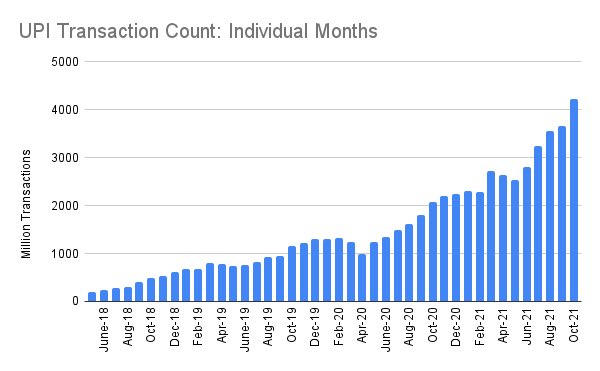


Continuing its upward trajectory, the Unified Payments Interface (UPI) clocked 4.22 billion transactions in the month of October, registering an increase from 3.66 billion transactions in the preceding month.
The corresponding transaction value also spiked from Rs. 6.54 lakh crore to Rs. 7.71 lakh crore. This was the first month when the UPI crossed $100 billion in transaction value since its inception.
The story of UPI is also a testament to the success of Digital India, especially after the demonetisation of 2016. What was once touted as a platform that would only cater to a few urban pockets, has quickly become ‘the’ payment interface for India, from buyers to sellers, from merchants as big as jewellers to as small as coconut sellers.
Today, coming across street vendors with nothing more than a bicycle and yet being able to offer an option to pay digitally is not uncommon anymore.
Now if the Govt. removes privately identifiable info and just adds demographic info such as region/sex/age group and sell this data and then pays all the people who are using the UPI based on revenues, this may be real winning idea for the govt in 2024. create a digital rupee and deposit in their account.Firstly, even at 4.2 billion transactions, the number of transactions, per individual, per month, on an average, if one factors a billion people is 4. Eliminate another 400 million citizens without the internet and it comes to down to roughly 7 transactions per month per individual.
If the holders of only Jan Dhan Accounts are factored, even then the average number of transactions is no more than 10.
India is set to register a billion internet users by the national elections of 2024, and has the future of retail moves online, or even in the virtual reality of the metaverse, more and more users will get accustomed to the UPI platform.
As ATMs and debit cards become obsolete, it will be the emergence of UPI in untapped markets and rural pockets that will become the norm for payments.
Clocking 50 billion transactions per month, for UPI, within the next five years, is no arduous task. Assuming a billion internet users, each making 50 transactions per month on an average, is quite simple.
This is not news. I have been seeing this in all parts of the country. Infact I was shocked to use cash for PUC certificate in Delhi.Cyrano wrote:The local fruit selling push cart vendor has a board with paytm QR code for digital payment. Cant upload photo, but I'm sure there are lakhs like him now. Thats very impressive penetration of digital !
Is it really the case that over one fourth of our GDP is transacted through UPI? What are the big payments here? Does this include business-to-business transfers, or salary payments for large segments of workers?Suraj wrote:UPI transactions hit the $100 billion mark in October...
Trailing 12 month data ending October in each of the last 5 years:
Oct 2021: $852B
Oct 2020: $397B
Oct 2019: $218B
Oct 2018: $56B
Oct 2017: $5B
I haven't seen analytical data on the transactions from UPI. Generally this should be VERY tightly maintained because it's worth its weight in gold and should never leave firewalled Indian data storage with strict data localization laws protecting it. UPI has already completely decimated western payment processing services like MC/Visa .yensoy wrote:Is it really the case that over one fourth of our GDP is transacted through UPI? What are the big payments here? Does this include business-to-business transfers, or salary payments for large segments of workers?Suraj wrote:UPI transactions hit the $100 billion mark in October...
Trailing 12 month data ending October in each of the last 5 years:
Oct 2021: $852B
Oct 2020: $397B
Oct 2019: $218B
Oct 2018: $56B
Oct 2017: $5B
Is UPI just a payment interface or does the term generically cover all sorts of online payment like NEFT/IMPS/RTGS/etc ? If the latter then I can believe the 1/4th of GDP number.yensoy wrote:Is it really the case that over one fourth of our GDP is transacted through UPI? What are the big payments here? Does this include business-to-business transfers, or salary payments for large segments of workers?Suraj wrote:UPI transactions hit the $100 billion mark in October...
Trailing 12 month data ending October in each of the last 5 years:
Oct 2021: $852B
Oct 2020: $397B
Oct 2019: $218B
Oct 2018: $56B
Oct 2017: $5B
UPI does not cover NEFT, IMPS or RTGS. Its purely mobile number based but can be used either on mobile or using web based interface.csaurabh wrote:Is UPI just a payment interface or does the term generically cover all sorts of online payment like NEFT/IMPS/RTGS/etc ? If the latter then I can believe the 1/4th of GDP number.yensoy wrote: Is it really the case that over one fourth of our GDP is transacted through UPI? What are the big payments here? Does this include business-to-business transfers, or salary payments for large segments of workers?
+1Suraj wrote: I haven't seen analytical data on the transactions from UPI. Generally this should be VERY tightly maintained because it's worth its weight in gold and should never leave firewalled Indian data storage with strict data localization laws protecting it. UPI has already completely decimated western payment processing services like MC/Visa .
What’s to believe ? Literally just add up the transaction value data on the UPI for prior 12 months. These are not hopeful estimates. They’re literally just data off UPI stats site I’ve been accumulating over a long time, along with a bunch of other data points I track,csaurabh wrote:Is UPI just a payment interface or does the term generically cover all sorts of online payment like NEFT/IMPS/RTGS/etc ? If the latter then I can believe the 1/4th of GDP number.yensoy wrote: Is it really the case that over one fourth of our GDP is transacted through UPI? What are the big payments here? Does this include business-to-business transfers, or salary payments for large segments of workers?
https://economictimes.indiatimes.com/in ... 506909.cmsGold sales have bettered pre-Covid levels this Dhanteras on Tuesday at 50 tonnes, almost 20 tonnes more than the 2019 Dhanteras on the back of widespread vaccination, fewer infections, and lower price of the yellow metal.
Kalyan Jewellers Ltd been witnessing a strong momentum in footfalls and revenue for the past three quarters, starting from the same period during the last financial year (Q3FY21), the company said in a regulatory filing.
Moving on from ratings criteria for grant of loans, banks are likely to focus on cash flow-based lending in times to come, a top executive of UCO Bank has said. "Banks will focus on cash flow based lending in times to come and this has already been started by SBI," Ajay Vyas, Executive Director, UCO Bank said at a virtual panel discussion on Redefining Corporate Financing in New Normal organized by PHD Chamber on December 23, 2020. ..
In response to queries from Mint, NPCI said that the intent of creating the BHIM app was to enable programme partners to use this as a starter app to become UPI compatible and allow their customers the convenience of using the UPI platform. “When it was created for the UPI platform two years ago, there were around 15 apps for UPI available. Today, we have more than 100 apps that have an interface with UPI. It was to create a BHIM-UPI app ecosystem where hundreds of apps were made available to the consumer," NPCI said.
Just UPI. IMPS/NEFT/RTGS are counted separately.csaurabh wrote:
Is UPI just a payment interface or does the term generically cover all sorts of online payment like NEFT/IMPS/RTGS/etc ? If the latter then I can believe the 1/4th of GDP number.
BHIM is not any kind of interface, it is just an app, and a mediocre one at that. The real mechanism/interface is UPI, which in turn is a wrapper around IMPS which has been around for a long time.saumitra_j wrote:That is correct, BHIM App was always a reference app from GOI. It only does money transfer but nothing beyond that. Gpay, Phone pay offer quite a few value added services. All have to use BHIM interface. UPI, Adhaar, eKYC - the so called India stack is a very well thought out digital architecture. Our fundamental economic problem that the digital architecture has to solve is extremely high volume but relatively low value of transactions and it has done a wonderful job at that! One interesting side effect of success of UPI is that Credit Card companies are losing out big time: Many merchants are happily using UPI / QR code based payments and have gotten rid of their credit card machines due to high merchant charges.
Here is an article on BHIM losing market share. Key point from NPCI:In response to queries from Mint, NPCI said that the intent of creating the BHIM app was to enable programme partners to use this as a starter app to become UPI compatible and allow their customers the convenience of using the UPI platform. “When it was created for the UPI platform two years ago, there were around 15 apps for UPI available. Today, we have more than 100 apps that have an interface with UPI. It was to create a BHIM-UPI app ecosystem where hundreds of apps were made available to the consumer," NPCI said.
PhonePe is desi (though owned by Walmart now) and so is PayTM (in a manner of speaking). In any case, this is less important, the main thing is that everything is based on UPI+IMPS and these apps are just a wrapper and as Suraj mentioned it is really important to ensure that they don't have access to mine Indian user transaction data for any purpose.Manish_P wrote:Thanks. I got now what you meant by a 'reference App'. And while I am a little bit more informed now, I still wish that a Desi app would take the lead (just like I had earlier wished for Rupay cards to trounce Visa and MC)..
The recovery of the Indian service sector was extended to October with the seasonally adjusted IHS Markit India Services PMI index signalling the strongest rate of growth in ten-and-a-half years. The index rose to 58.4, from 55.2 in September as the expansion in services activity extended to three months.
The survey said that overall “private sector output in India increased at a sharper rate in October as growth quickened among both manufacturers and service providers. The Composite PMI Output Index rose from 55.3 in September to 58.7, signalling the strongest monthly expansion since January 2012."
-October data highlighted a sixteenth successive monthly increase in input costs
-New orders rise at joint-fastest pace since July 2011
-Indian firms were able to secure a healthy intake of new work despite charging more for their services.
-Services companies continued to hire additional workers in October. Although moderate, the pace of job creation quickened from September to the strongest since February 2020
-Although service providers were confident that business activity would increase over the course of the coming 12 months, the overall level of sentiment was little-changed from September and well below its long-run average.
India's manufacturing activity gained momentum in October, hitting an eight-month high, as companies scaled up production in anticipation of improvement in demand, a private survey showed.
Data released by the IHS Markit showed Purchasing Managers’ Index (PMI) rose to 55.9 in October expanding for the fourth consecutive month even as it stayed below the February reading of 57.5. A reading above 50 indicates expansion in economic activity and a number below that signals contraction.
The second devastating wave of coronavirus pandemic had hit the country in March, affecting manufacturing activity. Rising from 53.7 in September, the latest data print is indicative of strongest improvement in overall operating conditions since February.
The data analytics firm said, amid reports of improved market confidence, rising requirements among clients and successful marketing, new orders continued to expand in October. “While strong growth of both sales and production were noted in each of the three broad areas of the manufacturing sector, it was in intermediate goods that the sharpest rates of expansion were recorded," it added.
In addition to reporting a substantial increase in total new orders, Indian companies observed a notable pick-up in international demand for their goods. “New export work rose at a solid pace that was the quickest in three months," it added.
Pollyanna De Lima, economics associate director at IHS Markit, said manufacturing sector growth in India continued to gather momentum, with October data showing notably quicker expansions in new orders, production and input purchasing. "With companies gearing up for further improvements in demand by building up their stocks, it looks like manufacturing activity will continue to expand throughout the third quarter of fiscal year 2021-22 should the pandemic remain under control. Upbeat business confidence and projects in the pipeline should also support production in the coming months," she added.
However, De Lima said rising input cost inflation which accelerated substantially in October to a near eight-year high is a matter of concern. “Strong global demand for scarce raw materials continued to push up prices for these items. Some manufacturers hiked their fees in response, but for now the overall rate of charge inflation was moderate. Despite the overall improvement in operating conditions, jobs failed to increase. This was often linked to sufficient capacity to deal with current workloads and government norms surrounding shift work."
People thronged the markets for festival purchases and helped generate business worth Rs 1.25 trillion, which is a record trade figure in the past 10 years on the occasion of Diwali, said Confederation of All India Traders (CAIT).
CAIT, which represents about 70 million traders, said such massive shopping has ended the economic slowdown in business which persisted for the past two years. It has also awakened the spark of better business prospects among the business community in the near future.
Excited and encouraged by tremendous Diwali business, the traders across the country are now gearing up for wedding season sales scheduled to start on November 14, said CAIT.
“In this year's Diwali festival, there is an estimated business of about Rs 1.25 lakh crore rupees in the entire country which is a record figure ever attained in the last decade,” said CAIT National President BC Bhartia and Secretary General Praveen Khandelwal. “In Delhi alone, this business was about Rs 25,000 crore.”
Bhartia and Khandelwal said that this time Chinese goods were not sold at all in the markets across the country and the special emphasis of the customers was on the purchase of Indian goods, due to which China suffered a direct loss of business worth more than Rs 50,000 crore.
The traditional items of the Diwali festival in demand were mostly earthen lamps, the colourful decor of earthen diyas, candles and paper mache lamps which gave a substantial business to small potters, craftsmen, handicraftsmen. Other products which were also in huge demand included sweets, dry fruits, footwear, watches, toys, home decor and fashion clothing.
Bhartia and Khandelwal said that this year, gold jewellery and silverware were purchased for more than Rs 9000 crore. This Diwali also brought a sizeable business to the tune of Rs 15,000 crore for packaging commodities. This Diwali has inspired traders across the country to adopt new ways of doing business in view of new opportunities and great potential for future business in India.
The first week of online festive sales in October, where various e-commerce firms participated, saw 23 per cent year-over-year sales growth in 2021. This means goods worth $4.6 billion (Rs 32,000 crore) have been sold online from brands and sellers during the festive sales, according to the latest report released by homegrown firm RedSeer Consulting.
RedSeer claimed that it has been seen that Flipkart Group emerged as the leader during the festive sales with an impressive 64 per cent market share.
Earlier, RedSeer Consulting had forecasted a sale of $4.8 billion in the first week of the festive sale. Further, the overall online shopper base grew by about 20 per cent compared to last year with Tier II contributing to about 61 per cent of all shoppers. Also, the overall GMV (gross merchandise value) per shopper has grown by 1.04X –indicating an inherent aspiration in the shopper.
E-commerce firms Amazon and Flipkart recently said the early trends of their festive sales event reflected increased participation from tier 2 and 3 cities. Amazon’s month-long Great Indian Festival 2021 and Flipkart’s The Big Billion Days started early in October.
Amazon recently said that its month-long Great Indian Festival (GIF) has seen the biggest ever shopping activity for its sellers and brand partners on Amazon.in, bringing services to millions of customers across the country. GIF started at midnight of October 2 with Prime Early Access and went live for all customers on October 3. Customers had access to the crores of product selection from sellers on Amazon including unique products from lakhs of Small and Medium Businesses (SMBs).
Customers from 99.7 per cent pin codes shopped during the month-long festive event. More customers shopped on Amazon than ever before, with 79 per cent of new customers coming from tier 2 and 3 towns like Ernakulam, Guntur, Krishna and Godavari. Customers experienced the Great Indian Festival in English, Hindi, Tamil, Telugu, Malayalam, and Kannada and the newly launched Bangla and Marathi along with voice shopping in Hindi and English. Local Shops on Amazon sellers clocked a 2x spike and sold over 10 products every minute.
As Bharat gets ready for 5G, more than 84 per cent of mid-range segment of smartphones bought on Amazon were 5G ready. More than one million customers purchased a smartphone on Amazon for the first time. About 1 in 6 smartphones and 1 out of 4 TVs sold during this time had Alexa Built in or worked with Alexa. Over 120 audio products were purchased every minute. Amazon’s voice assistant Alexa answered over 36 million requests during the Amazon Great Indian Festival 2021.
With the country’s online market projected to soar to $1 trillion, players such as Amazon, Walmart-owned Flipkart, Reliance's JioMart and Tata Group, are betting big on e-commerce and are in fierce competition with each other.
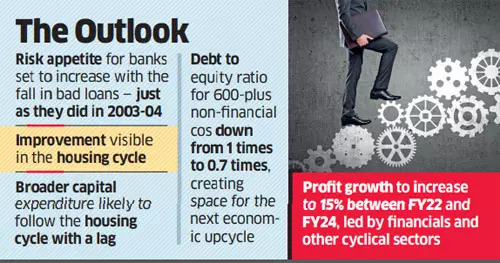
The Indian economy is poised for a repeat performance of growth last seen between 2003 and 2010 led by corporate deleveraging and profitability, lower bad assets and demand for housing, Jefferies said.
India's economic growth averaged 8.5% to 9% between 2003 and 2010, up from the 5.5%-to-6% average before that.
The US brokerage analysed six key components of the economic cycle: Demand for housing, drop in bank NPAs, corporate profitability, interest rates, corporate leverage and capex revival.
"Between 1997 and 2004, bank gross NPA ratio moved down from 16% to 8%. Similarly, the Indian banking system's gross NPA has moved down from 12% in March 2018 to 7% now and alongside a provisioning jump, the net NPAs are down 59%," Jefferies said. "Provision costs are off drastically. While banks are still risk-averse, we believe that the stage is now set for an increase in risk appetite. Strong capability and seven-year high RoEs further support lending growth."
he PHDCCI Economy GPS Index for October 2021 increased to 131 as compared with 113.1 in the previous month. During the April-October 2021 period, it stood at 114.8 as compared with 78.7 in the previous financial year, the chamber stated.
https://economictimes.indiatimes.com/ne ... 559167.cmsGST collections indicate the momentum of business activity, passenger vehicle sales is a broad indicator of demand activity in the economy and the movement of the Sensex indicates the mood of both domestic and foreign investors, the chamber said.
We’ll have to see if the higher levels of GST collection can be maintained post the festival season… But, as of now, things are looking up. Even bank credit is showing signs of recovery,” said Sabnavis. G Chokkalingam, managing director at Equinomics Research, said most high-frequency indicators – such as diesel sales, truck and rail freight rates, spatial distribution of monsoon, water storage levels in reservoirs, life insurance premiums and domestic pharmaceutical formulation sales– are showing an upward trend.
“There’s strong recovery, but it is biased towards the organised sector and mid-to high-income earners, and is now restricted to urban pockets. There could be stress among MSMEs (micro, small and medium enterprises) and low-income households.”
The recovery of the Indian service sector was extended to October with the seasonally adjusted IHS Markit India Services PMI index signalling the strongest rate of growth in ten-and-a-half years. The index rose to 58.4, from 55.2 in September as the expansion in services activity extended to three months.
The survey said that overall “private sector output in India increased at a sharper rate in October as growth quickened among both manufacturers and service providers. The Composite PMI Output Index rose from 55.3 in September to 58.7, signalling the strongest monthly expansion since January 2012."
-October data highlighted a sixteenth successive monthly increase in input costs
-New orders rise at joint-fastest pace since July 2011
-Indian firms were able to secure a healthy intake of new work despite charging more for their services.
-Services companies continued to hire additional workers in October. Although moderate, the pace of job creation quickened from September to the strongest since February 2020
Manish Singh
Thu, November 11, 2021, 10:44 AM
SoftBank Group chief executive Rajeev Misra said the fund has invested $3 billion in Indian companies this year and can invest $5 billion to $10 billion next year, the latest aggressive play by a top investment firm in the South Asian nation, where young firms have raised over a record $20 billion this year.
“If we find the right companies, we could invest $5 billion to $10 billion in 2022,” said Misra at a virtual conference on Thursday, adding the caveat that SoftBank will explore such opportunities “at the right valuations.”
Misra said the firm has slowed the pace of investment in China, but will continue to stay in it as the Asian economy is a major center of AI in the world.
Scores of global investors deployed tens of billions of dollars in India in the past decade as they searched for early winners in the world’s second-most populous nation. The dealflow activities have surged significantly this year as Tiger Global, SoftBank, Falcon Edge Capital and Sequoia Capital India have aggressively chased deals and backed firms at record valuation jumps.
Tiger Global, in particular, has backed over two dozen startups, many still in early stages of their journeys, in India this year. The firm reportedly told shareholders earlier this year that India was one of the top priorities with its new fund.
:
:
:
:
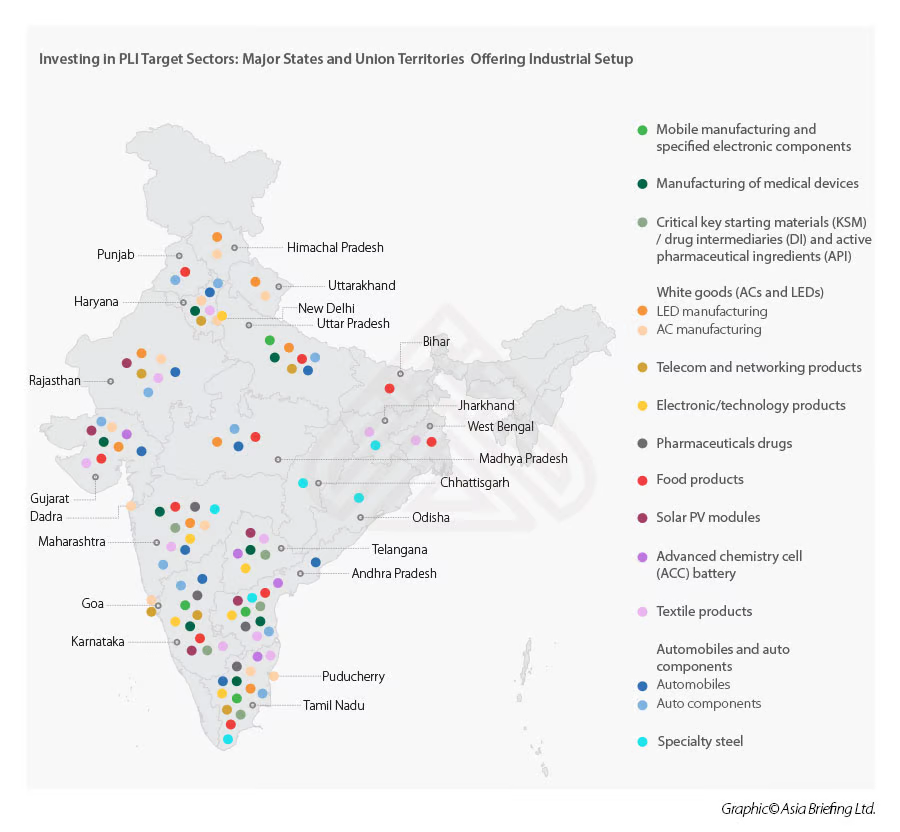
Prasanna Viswanathan. @prasannavishy
Great chart. State-wise Investment outlook for the Rs.1.97 Lakh Crores Production-Linked Incentive (PLI) Schemes for 13 key sectors.
India’s overall exports jumped to $56.51 billion in October, exhibiting a positive growth of 35.16% over the same period last year and a positive growth of 29.13% over October 2019, the Ministry of Commerce & Industry said on Monday.
India’s overall exports (merchandise and services combined) in April-October were estimated to be $369.39 billion, registering a positive growth of 39.83% over the same period last year and 19.97% over April-October 2019.
Link was not workingkit wrote:https://www.mckinsey.com/industries/fin ... we-using-o
Why is india not anywhere in this list