The FAQ just above that one says 14 days after resolution of symptoms. That is conflicting information right there. I guess I will wait.srin wrote:The link above suggests wait of 4-8 weeks.Thakur_B wrote:
https://www.mohfw.gov.in/covid_vaccinat ... /faqs.htmlIs it necessary for a COVID-19 recovered person to take the vaccine? And if I had COVID-19 infection and was treated, why should I receive the vaccine?
Yes, it is advisable to receive complete schedule of COVID-19 vaccine irrespective of past history of infection with COVID-19. This will help in developing a strong immune response against the disease. Development of immunity or duration of protection after COVID-19 exposure is not established therefore it is recommended to receive vaccine even after COVID-19 infection. Wait for 4-8 weeks after recovery from COVID symptoms before getting the vaccine.
Wuhan Coronavirus Resource Thread
Re: Wuhan Coronavirus Resource Thread
Re: Wuhan Coronavirus Resource Thread
Prof Agrawal, and few others from the super modeling team (and also from DST and IIT's) are now a little more active on SM and those tweets are an excellent resource - The Indian Newspapers have done some *really* bad job in reporting in the past - IMO there should have been a good public domain data-sharing would have done better. I think a good site will be up soon. The parameter(s) (which changes over the time) and method itself is well published so one can do one's own calculation to see various scenarios. Had some interesting conversation with these professors, let me post my take (and stories which are already well known) wrt to your queries (and most media stories about "failed model" etc.arshyam wrote:
I have been tracking Prof Agrawal's tweets (where he shares his graphs) and the fit is indeed remarkable. What gives hope is that multiple cities/states are now trending down, so that should ease some pressure off healthcare infra.
However, I wonder what this graph looked like in the February-early March timeframe? I looked around, but couldn't find any older charts. The reason for my Q is rather obvious, but will state it for clarity: did this model predict this steep spike in April? Last I recall, per this model and your earlier posts, this thing should have died out in February, but it didn't. I, for one, had set a lot in store by this prediction (my pandemic fatigue played a role too), but turned out to be so far off the mark. One wonders if the govt felt the same way too?
Some points: (This is *my* take - and my take only - take it FWIW) Sorry for long post ..
1- It is mathematical modeling - not absolute correct "prediction" (as in astrology), viruses don't behave exactly like your model and one learns more science..
2 - True: The "model" (initially IIRC in July or so)predicted peak in September and generally dying down around last week of February (even without vaccines).. No second wave (generally speaking) was expected then. This is what I posted here in brf too.
3 - True - the team expected mutation and even pandemic fatigue (people will be not wearing masks that religiously etc) but they were still fairly sure of no serious "second wave" - some minor hiccups, local flare-ups etc but not what we have now.
4 - We expected mutation but *no* one could guess it will be that bad (B117, P1 and our own B1.116) with *such* a high R factor (beta parameter - in super model) - Since India does not have good gene sequencing we were late in finding how prevalent these VoC were in India. (The data from UK/US/Canada worried many of us tremendously - I literally remember getting very scarred just looking at the graphs - the situation will become 'horrendous' etc .. but were hoping it will not spread to India - More of this later - when more data is available). (I remember one person, looking at some Canada data with P1 variants - and literally remarking "it's the end of the world" if it spreads to India - was that scary)
5 - Data till the end of February was still matched - relatively good fit - the projection (death rates came down to 100/day or so etc)
6 - Some got worried that (around end of Feb) that the "decay" was not fast enough -- but still even in the first week of March many were "hoping" (or wanted believe it's just local variation - not change in parameter)
) that there will be no nation-wide "second wave" and places like Mumbai and Punjab will be contained. (Many remote places in India still do not show the second peak till now).
7 - By the end of March everyone was sure of the second wave, was real , its exponential growth, it's timing etc.
(I still have all the graphs (or parameter values) shared by Prof Agrawal - good learning material -- Basically model is quite reliable .. The "big" phase transition (which in model takes about 15 days to stabilize ) makes even best of us "wrong (mostly uncertain)" in their prediction. The model and data have been fitting pretty well for last few weeks.
(Just for perspective in the beginning of April one of the chart showed 170,000 (cases/per day), my calculation was closer to 250,000 cases/day - best we could say was the peak is around this time (much more certain) and height would be 170K (or 2 or 3 times that - depending on various factors) - the value is around 400,000 now)
Sorry for the long post -- May be brf is not a place for this but some parts take a long to explain. There are some very good resources about the model and data.. etc.
Re: Wuhan Coronavirus Resource Thread
No issues at all Amber G-ji, BRF has many long posts for explaining complex issues, we are not Twitter, after all. I really appreciate these insights, thanks!Amber G. wrote: Some points: (This is *my* take - and my take only - take it FWIW) Sorry for long post ..
1- It is mathematical modeling - not absolute correct "prediction" (as in astrology), viruses don't behave exactly like your model and one learns more science..
2 - True: The "model" (initially IIRC in July or so)predicted peak in September and generally dying down around last week of February (even without vaccines).. No second wave (generally speaking) was expected then. This is what I posted here in brf too.
3 - True - the team expected mutation and even pandemic fatigue (people will be not wearing masks that religiously etc) but they were still fairly sure of no serious "second wave" - some minor hiccups, local flare-ups etc but not what we have now.
4 - We expected mutation but *no* one could guess it will be that bad (B117, P1 and our own B1.116) with *such* a high R factor (beta parameter - in super model) - Since India does not have good gene sequencing we were late in finding how prevalent these VoC were in India. (The data from UK/US/Canada worried many of us tremendously - I literally remember getting very scarred just looking at the graphs - the situation will become 'horrendous' etc .. but were hoping it will not spread to India - More of this later - when more data is available).
5 - Data till the end of February was still matched - relatively good fit - the projection (death rates came down to 100/day or so etc)
6 - Some got worried that (around end of Feb) that the "decay" was not fast enough -- but still even in the first week of March many were "hoping" (or wanted to fit the curve) that there will be no nation-wide "second wave" and places like Mumbai and Punjab will be contained.
7 - By the end of March everyone was sure of the second wave, was real , its exponential growth, it's timing etc.
(I still have all the graphs (or parameter values) shared by Prof Agrawal - good learning material -- Basically model is quite reliable .. The "big" phase transition (which in model takes about 15 days to stabilize ) makes even best of us "wrong" in their prediction. The model and data have been fitting pretty well for last few weeks.
Sorry for the long post -- May be brf is not a place for this but some parts take a long to explain. There are some very good resources about the model and data.. etc.
These points help me understand why we were not prepped enough. I agree that the model is not an exact prediction, so I am not blaming the model itself, rather trying to understand why we got into this situ. Your points help clarify that - the model didn't have sequencing data, so perhaps did not anticipate what was next (why wasn't sequencing made a priority is a Q that comes from this). The govt also was perhaps lulled into a false sense of security since no expert, based on data, predicted the tsunami that was to come. So while GoI didn't stop the longer term policies for vaccination or oxygen prep (again, based on available data in Dec, they had sanctioned ~160 odd plants around the country) or messaging (yes, even the PM kept reiterating about Covid-appropriate behaviour, though hardly any one listened), they didn't get galvanized into a wartime mode since there was little indication* of what was to come. All states did drop the ball on continuing prep - the lack of progress in installing the approved oxygen plants is a clear indication. That the centre did not follow up on this lack of progress again points to a false sense of security. Most of us felt that the worst of Covid was behind us, and vaccination would take care of the rest.
* I said "little indication" as you mentioned a few people were worried that the decay didn't happen fast enough. So there must have been some murmurs, but it would not have been strong enough to influence policy.
-
sanjaykumar
- BRF Oldie
- Posts: 6865
- Joined: 16 Oct 2005 05:51
Re: Wuhan Coronavirus Resource Thread
The second wave was predictable if modelling of human behaviour had been done. Hesitancy to masking, social distancing and vaccination. What’s not to predict? Modi did a fabulous job implementing the lock down. He was condemned and ridiculed.
Yes all this is in retrospect. Only New York Italy Spain Britain California were ominous.
Yes all this is in retrospect. Only New York Italy Spain Britain California were ominous.
Re: Wuhan Coronavirus Resource Thread
So in a nutshell, a new coronavirus mutant (desi or from UK/Canada) with a very, very high R factor appeared on the scene (India) mid-March and this was the cause of the current peak?Amber G. wrote: 7 - By the end of March everyone was sure of the second wave, was real , its exponential growth, it's timing etc.
(I still have all the graphs (or parameter values) shared by Prof Agrawal - good learning material -- Basically model is quite reliable .. The "big" phase transition (which in model takes about 15 days to stabilize ) makes even best of us "wrong (mostly uncertain)" in their prediction. The model and data have been fitting pretty well for last few weeks.
(Just for perspective in the beginning of April one of the chart showed 170,000 (cases/per day), my calculation was closer to 250,000 cases/day - best we could say was the peak is around this time (much more certain) and height would be 170K (or 2 or 3 times that - depending on various factors) - the value is around 400,000 now)
-
sanjaykumar
- BRF Oldie
- Posts: 6865
- Joined: 16 Oct 2005 05:51
Re: Wuhan Coronavirus Resource Thread
R factor is not an immutable property of a virus. It is operationally defined. The biggest variable in a pandemic is human behaviour not viral behaviour. High virulence cannot be easily modified, infectivity can.
Re: Wuhan Coronavirus Resource Thread
400k cases today. the numbers are not going down 
STATE CASES ACTIVE RECOVERED DEATHS
Maharashtra 48,80,54257,640 6,43,782286 41,64,09857,006 72,662920
Kerala 17,43,93241,953 3,76,00418,789 13,62,36323,106 5,56558
Karnataka 17,41,04650,112 4,87,30822,925 12,36,85426,841 16,884346
Uttar Pradesh 13,99,29431,111 2,62,47410,094 11,22,66940,852 14,151353
Tamil Nadu 12,72,60223,310 1,28,3113,081 11,29,51220,062 14,779167
Re: Wuhan Coronavirus Resource Thread
:like: :+72:sanjaykumar wrote:The second wave was predictable if modelling of human behaviour had been done. Hesitancy to masking, social distancing and vaccination. What’s not to predict? Modi did a fabulous job implementing the lock down. He was condemned and ridiculed.
Yes all this is in retrospect. Only New York Italy Spain Britain California were ominous.
Thanks for succinctly pointing out that the human behaviour is a variable that was not modeled.
For example, It could be isolation fatigue, for examples the number of informal house calls one makes in India is tremendous. In West, one has to have a formal time allocated.
Vaccine hesitancy is another behaviour. I had friends say that GOI could have done better PR! How about some self-control by motor mouths in media and parties outside of government? For this pandemic was a political football.
Social distancing requires new way of doing things. Some behaviours are hard set. Even now Virat Kohli washes his kachas and hangs it up on the string in public while it dries. Social distancing is a behaviour which hard pressed to be placed in India. Doable, requires constant communication.
Re: Wuhan Coronavirus Resource Thread
This may be the opinion of who you interacted with and can be easily proven incorrect. GoI was putting out regular press releases on second wave surge as early Feb 20 and was talking to affected state governments, but no one paid attention. This was not a sudden wave as everyone assumes, it took 1.5 months to go exponential. When people are not using common sense items such as masking and social distancing, governments can do very little.Amber G. wrote:
5 - Data till the end of February was still matched - relatively good fit - the projection (death rates came down to 100/day or so etc)
6 - Some got worried that (around end of Feb) that the "decay" was not fast enough -- but still even in the first week of March many were "hoping" (or wanted believe it's just local variation - not change in parameter)
) that there will be no nation-wide "second wave" and places like Mumbai and Punjab will be contained. (Many remote places in India still do not show the second peak till now).
7 - By the end of March everyone was sure of the second wave, was real , its exponential growth, it's timing etc.
(I still have all the graphs (or parameter values) shared by Prof Agrawal - good learning material -- Basically model is quite reliable .. The "big" phase transition (which in model takes about 15 days to stabilize ) makes even best of us "wrong (mostly uncertain)" in their prediction. The model and data have been fitting pretty well for last few weeks.
.
I will list few GoI press releases below:
Feb. 20:
https://pib.gov.in/PressReleseDetail.aspx?PRID=1699596
Kerala, Maharashtra, Punjab, Chhattisgarh & MP witnesses an upsurge in Daily New Cases
^4 states
Feb. 21:
https://pib.gov.in/PressReleseDetail.aspx?PRID=1699735
Centre writes to States Witnessing Spike in Daily New Cases
Feb. 24More than 74% of the Active Cases of the country are in Kerala and Maharashtra. Of late it is seen that there has been a spike in the daily cases in Chhattisgarh and Madhya Pradesh also. Punjab and J&K too are witnessing a surge in daily new cases.
https://pib.gov.in/PressReleseDetail.aspx?PRID=1700363
Centre Rushes Multi-disciplinary High Level Central teams to States/UTs witnessing surge in cases
^10 states/UTsThe Centre has deputed high level multi-disciplinary teams to Maharashtra, Kerala, Chhattisgarh, Madhya Pradesh, Gujarat, Punjab, Karnataka, Tamil Nadu, West Bengal and Union Territory of Jammu and Kashmir for supporting them in public health measures for targeted COVID response and management, and effectively tackling the pandemic.
Feb 25:
https://pib.gov.in/PressReleseDetail.aspx?PRID=1700689
Feb 27:
https://pib.gov.in/PressReleseDetail.aspx?PRID=1701321
Cabinet Secretary Reviews the Surge in COVID cases in Telangana, Maharashtra, Chhattisgarh, Madhya Pradesh, Gujarat, Punjab, J&K and West Bengal
https://pib.gov.in/PressReleseDetail.aspx?PRID=1701292
Kerala, Maharashtra, Punjab, Karnataka, Tamil Nadu and Gujarat record an upsurge in Active Cases
Feb 28:
https://pib.gov.in/PressReleseDetail.aspx?PRID=1701466
Kerala, Maharashtra, Punjab, Karnataka, Tamil Nadu and Gujarat continue to report an upsurge in COVID New Cases
There was a press release on surge practically everyday from at least 10 states or 1/3 of the country from Feb 20 to now. So it is incorrect to state that there was nothing in Feb/early March.
Re: Wuhan Coronavirus Resource Thread
It is NDTV, but helps to know how are cases being admitted to Hospital.
"If a patient has a fever, and I know he's sick but he's not requiring oxygen, I can't admit him," he says.
"That's the criteria. People are dying on the streets without oxygen. So people who don't require oxygen, even if they are sick, so we don't admit them usually."
That's one choice.
"Another choice is I have an old male and I have a young guy. Both are requiring high-flow oxygen; I have only one bed in the ICU. And I can't be emotional at that time, that he is a father to someone. The young have to be saved."
Re: Wuhan Coronavirus Resource Thread
Now that GoI has confirmed that 3rd wave is inevitable, we should be looking at Covid anti-viral therapies and other stuff to combat.
Yesterday, GoI approved Renegeron Antibody Cocktail for EUA. Similarly, I would urge GoI to look at that Canadian nasal spray which is supposedly providing encouraging results. Even if the drug is not approved yet in their home country, if the developer is willing to tie up with a local partner (Cipla, Ranbaxy drug giants) and is willing to assume some liability, GoI should OK at least Ph-3 trials in India.
Experts are predicting that next wave might hit kids/children hard and I don't think we would have completed even 50% vaccination of 18-44 age group by 3rd wave let alone starting kids. Almost 40% of India is less than 18 year old...
One of the points from Amber G's excellent post is the not enough gene sequencing of variants. Dumb question, what does it take to do a gene sequencing? in BLR alone, we are testing I think above 1L plus...there are lots of GoI institutions which are involved in Biological Sciences and not to mention limited private institutions. Does one need access to a supercomputer or HPC cluster to do gene sequencing?
I am pretty sure the people who matter in admin are aware of the above issues...just hoping that they will do something to stay a little ahead of the virus. Of course human behavior is entirely unpredictable but with right massive messaging campaign, one can at least hope that many people start paying attention and impact can be mitigated.
Re: Wuhan Coronavirus Resource Thread
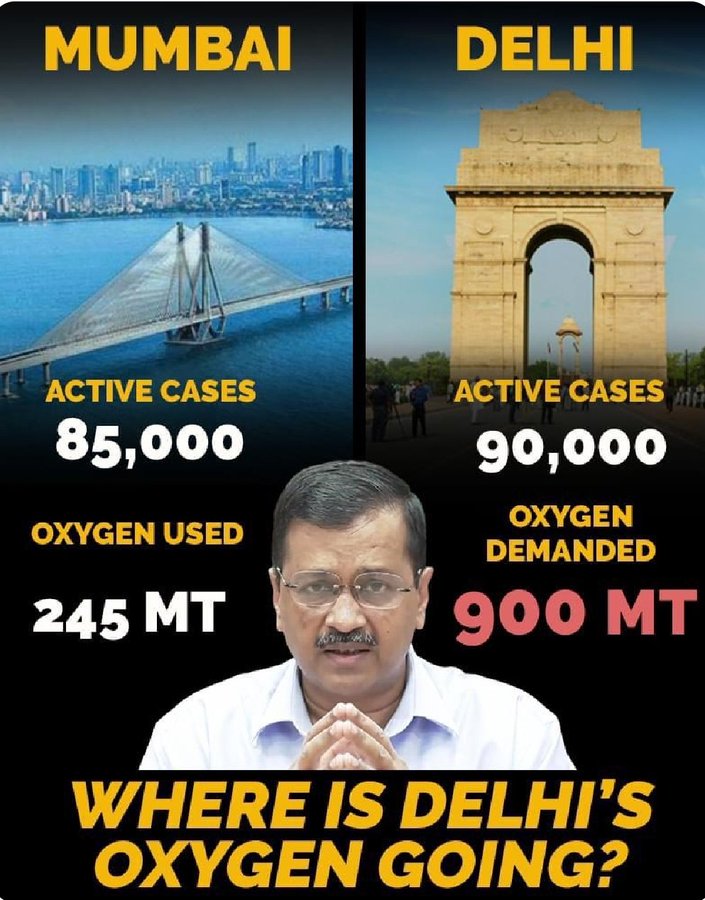
Where indeed, and the demand is rapidly climbing.
anyone know why
anyone know why
Re: Wuhan Coronavirus Resource Thread
One more casualty . . . .
RLD chief Ajit Singh succumbs to Covid
RLD chief Ajit Singh succumbs to Covid
Re: Wuhan Coronavirus Resource Thread
Infection numbers is not a good parameter to gauge the trend. Look for positive rates. We are doing more than 2 million tests per day. More the test, more the numbers.Atmavik wrote:400k cases today. the numbers are not going down
Positive rates, stress on hospitals, rate of death. That should show the trend.
Looks like things have plateaued or decreases in Delhi & MH. Lot of places will peak in mid May. So the overall numbers will remain high as many cities peak in may.
Re: Wuhan Coronavirus Resource Thread
NDTV/Bloomberg article on India's ability to Genome sequencing...
The Good News Is That Vaccines Work Against India Strain. The Bad News...
Posting excerpts...
The Good News Is That Vaccines Work Against India Strain. The Bad News...
Posting excerpts...
The bad news is it won't be only the new version of the pathogen to emerge from an outbreak of this scale, underscoring the urgency of mapping other possible variants that may be currently racing through India's tightly-packed population of 1.4 billion people.
As infections surge by more than 300,000 cases for 14 straight days, pushing India's tally past 20 million, the country's limited ability to track new mutations emerging from its outbreak is a growing concern for scientists.
Second- or even third-generation versions of the variant known as B.1.617 could already be circulating in India and some may be more dangerous, said William Haseltine, a former Harvard Medical School professor who now chairs think tank Access Health International.
"India has the necessary genome sequencing capabilities but it needs to have a mass surveillance program," Haseltine said. "I'll be on the lookout for more and newer variants, given the opportunity the virus has had with such a massive outbreak."
While the findings ease concerns around B.1.617, researchers are turning to the next set of variants as India's outbreak continues to rage. Genomic surveillance can provide crucial information on the new forms of this shape-shifting virus -- critical in preventing subsequent waves and developing the next generation of vaccines.
In the U.S., recent studies published by the Centers for Disease Control and Prevention show that a variant that caused concern when it emerged in New York isn't more dangerous than earlier strains, while a pair of mutants that surfaced in southern California "might more frequently cause discernible and severe illness than do nationally circulating lineages overall."
The WHO has been monitoring variants through a global working group of laboratories, said Maria Van Kerkhove, the agency's technical lead officer. Information about new variants is coming in "fast and furious," she said.
But as its health system is stretched to breaking point and Prime Minister Narendra Modi resists calls for a lockdown, the country's labs are ill-equipped to keep up with the necessary monitoring. Genomic sequencing that can identify new strains and track their progress is still relatively sparse in India, where only about 11,000 viruses have been analyzed, according to Mishra.
While countries like the U.K. monitor about 5% to 10% of cases, in India far fewer are sequenced. To do so would require analyzing tens of thousands of samples daily, and failing to leaves a huge blind spot, according to Ashish Jha, dean of Brown University's School of Public Health in Rhode Island.
"What genomic surveillance does," he said, "is it helps you really track where infections are going and how things are spreading in a way India was pretty blind to."
Re: Wuhan Coronavirus Resource Thread
Pfizer's Insistence On Protection Against Lawsuits In Case Of Adverse Events Stalls India Approval Of Its Covid Jab: Report
Pfizer's Insistence On Protection Against Lawsuits In Case Of Adverse Events Stalls India Approval Of Its Covid Jab: Report
Swarajya Staff
May 6, 2021
Covid-19 Vaccination Drive
Pfizer has reportedly demanded protection against liability arising out of the adverse events linked to its Covid-19 vaccine in India.
The United States pharma major is yet to get approval in India for its Covid-19 vaccine that it has developed in collaboration with BioNTech.
The discussions over the Pfizer vaccine's roll-out in India have been stalled as the company has asked the government to indemnify it against lawsuits in case of adverse effects linked to its jab, reports Economic Times.
The US pharma giant has reportedly signed an indemnity clause with many countries that are using its vaccine. The clause absolves the company from paying any legal cost in case of an adverse event.
Pfizer CEO Albert Bourla had on Monday (3 May) said that the company is in discussions with the Indian government for an "expedited approval pathway" for its Covid-19 vaccine.
However, Pfizer's demand for indemnity has become a major roadblock in the discussions as India, unlike other countries, does not offer any protection against adverse effects such as serious illness or death caused by the vaccine.
“This cannot be given to one company. If it is given to Pfizer then the domestic companies will ask for the same too,” a government officials was quoted by ET as saying.
It should be noted that the two Covid-19 vaccines approved in India - Serum Institute of India's Covishield and Bharat Biotech's Covaxin - has not been granted indemnity against lawsuits in case of adverse events.
While granting emergency licensese to SII and Bharat Biotech for their Covid vaccines, the government had not accepted the vaccine makers demand that they be indemnified against mishaps.
Re: Wuhan Coronavirus Resource Thread
Zydus Cadila Ready with Flag of India India's Second Fully Indeginous #CovidVaccine ; Applies for Emergency Use Authorisation after Phase 3 Interim Trial Efficacy Data .
Ready to Roll Out 1 Cr Doses/Month
India could soon have another locally developed vaccine as the deadly Covid crisis shows no signs of slowing THU, APR 29 2021
Ready to Roll Out 1 Cr Doses/Month
India could soon have another locally developed vaccine as the deadly Covid crisis shows no signs of slowing THU, APR 29 2021
India could soon have its second domestically developed coronavirus vaccine even as a deadly second wave shows no signs of slowing down anytime soon.
Drugmaker Cadila Healthcare, also known as Zydus Cadila, is conducting phase three clinical trials on 28,000 people, including those above 75 and children between ages 12 and 18, for its DNA-based vaccine candidate.
"We have completed the major recruitment for our phase three (trial)," managing director Sharvil Patel told CNBC's "Street Signs Asia" on Thursday.
He said the company expects efficacy data from the phase three trial to come out next month after which, it would seek emergency use authorization from the Indian drug regulator in mid-May.
"On the safety and efficacy in our phase two (trials) as well as ongoing phase three, we've seen very good data on safety and strong data on immunogenicity, comparable to most of the other vaccines that are there," Patel said.
Vaccination campaign
India began its vaccination campaign in January and as of Thursday, government data showed more than 150 million doses have been administered. But only about 25.8 million second doses have been administered.
Currently, India is using the AstraZeneca vaccine, locally known as Covishield and produced by the Serum Institute of India, and Bharat Biotech's Covaxin.
Re: Wuhan Coronavirus Resource Thread
I know we are not supposed to talk conspiracy but there are rumors that this sudden spike that India has seen is part of biowarfare. No, the virus is natural but the sudden spiky spread of it all over India looks to be induced given how rapidly the graphs scaled up. Especially after high immunity from exposure last year and immunization of a 100 million people, this should not have been the case.
Yes, it’s a conspiracy theory but the numbers are very odd. And there are many talking about it.
Yes, it’s a conspiracy theory but the numbers are very odd. And there are many talking about it.
Re: Wuhan Coronavirus Resource Thread
some viruses are more infectious than others. This aspect needs to be confirmed and considered quite apart from what is modifiable and what is not.sanjaykumar wrote:R factor is not an immutable property of a virus. It is operationally defined. The biggest variable in a pandemic is human behaviour not viral behaviour. High virulence cannot be easily modified, infectivity can.
Re: Wuhan Coronavirus Resource Thread
Reliance To Fly In Israeli Experts To Operationalize Diagnostic System That Determines Covid-19 Status Within Seconds
Mukesh Ambani led Reliance Industries (RIL) has sought special permission to fly a team of experts from Israel to India to train and install a rapid Covid-19 identification solution it acquired from an Israeli start-up for $ 15 million.
Reliance signed the deal in January with Breath of Health (BOH) to distribute the firm's swift Covid-19 breath testing system. The innovative system developed by Israeli medical technology company identifies coronavirus carriers and patients in the early stages of the disease by exhalation and the results will be available within seconds.
The experts from BOH will guide Reliance's team in India in operating the innovative system, reports The Economic Times.
"The equipment has already reached India and its operationalization will help India in its fight against the pandemic," a company spokesperson said.
"The company staff will train Indian teams to use technology which is considered as a breakthrough in the field and may help the Indians to take control of the Indian variant outbreak", the Israeli company said.
Re: Wuhan Coronavirus Resource Thread
There are many things to say about it given the step response. However, that still brings the blame back within India and not outside. A flu season is coming with vaccination crowding. Govts weren't prepared. Period. Even PM had been seen without mask on multiple occasions. Why was GoI so confident about not seeing other variants? Forget about overseas. India itself had breeding ground ongoing in places like MH, Delhi, etc.Jarita wrote: Yes, it’s a conspiracy theory but the numbers are very odd. And there are many talking about it.
Intentional, accidental, or nature: the education in general wasn't getting into the public's brain. Why? Recently there are many in my contacts just coming to realization that it is spreading through the air. Yes, geniuses. That's what people like me have been screaming about for a year. Finally they have gone into real lockdown. No more sneaking in food from outside and having neighborhood parties during this volunteer lockdown. Other than the poor, no one had any excuse to not wear masks. Even majority of mask wearers are uneducated about how to stay safe with it. I bet that 1918 India had better common sense.
GoI should think about utilizing a homemade mask disinfectant concoction based on peroxide, quats, etc. Many just have no idea that their mask is no longer usable and they continue to wear it and not change it till next day. Quick sprays may help disinfect cloth masks through out the day.
Similarly misinformation is running about vaccination. Not the hesitant one but the misinformation that after the vaccine I'm invincible.
There's also a problem of being too cordial, formal, nice, etc. when it comes to being strict about what's required to be safe and people around.
I have no idea why any model in India would have assumed people wearing masks. Even if you are wearing one, there are many difficulties around it. Certainly people weren't wearing within their homes in densly packed housings and weird wind patterns for ventilation.
Offensive bio weapons are also required. Vaccines and drugs won't be enough to stop the barrage.
Re: Wuhan Coronavirus Resource Thread
Sorry if posted before.darshan wrote:If Google is correct, Dr. Kapila's age was around 83. No information on other existing illnesses.
Just to clarify, got a response from a close friend who knows the family:
This is the update from MAMCOANA WhatsApp group Re: Dr Kapila:
“Prof. Kapila 83 years of age had history of Diabetes and CAD S/P stents. He had received 2 doses of mRNA vaccine a month before leaving for India.
During his visit he contracted COVID-19 and was hospitalized for 4 days but signed out against medical advice.
Thereafter he was admitted to a different hospital where he continued to recover from Covid pneumonia and at anytime did not require any assisted breathing.
On the seventh day he passed away following a massive heart attack in the early morning hours.
COVID is known to cause heart problems, the doctor probably succumbed to his pre-existing disease complicated by COVID, but it was not the infection per se that killed him. So the vaccine does protect. In my own family, an 84 yr old relative also got infected after two doses of Pfizer vaccine but had mild fever for two days with full recovery thereafter.
-
DrRatnadip
- BRFite
- Posts: 604
- Joined: 31 Dec 2016 00:40
Re: Wuhan Coronavirus Resource Thread
- There is No doubt at all that vaccines are saving lives..
- This strain is very virulant.. Some Pts die very fast .. No known intervention is able to help.. Even pregnant ladies , which were almost immune from severe disease in first wave are getting affected and even deaths are reported in them.. Mucormycosis is rising in those treated with steroids..
-Psycological issues like major depression, anxiety attacks , insomnia are more frequent than last year..
- We MUST vaccinate maximum population soon.. There is fair chance that virus will mutate in more virulant and infective form.. Vaccination is only way to prevent that from happening..
Re: Wuhan Coronavirus Resource Thread
On 4/26/21 the increase in new cases (i.e. confirmed cases - recoveries) was 126 k (7 day average). Ever since that day that number has been declining. Today it is 69k. At this rate we should see negative number by mid May. That is the only small ray of hope I can find.nam wrote:Infection numbers is not a good parameter to gauge the trend. Look for positive rates. We are doing more than 2 million tests per day. More the test, more the numbers.Atmavik wrote:400k cases today. the numbers are not going down
Positive rates, stress on hospitals, rate of death. That should show the trend.
Looks like things have plateaued or decreases in Delhi & MH. Lot of places will peak in mid May. So the overall numbers will remain high as many cities peak in may.
Re: Wuhan Coronavirus Resource Thread
DrRatnadip wrote:- There is No doubt at all that vaccines are saving lives..
- This strain is very virulant.. Some Pts die very fast .. No known intervention is able to help.. Even pregnant ladies , which were almost immune from severe disease in first wave are getting affected and even deaths are reported in them.. Mucormycosis is rising in those treated with steroids..
-Psycological issues like major depression, anxiety attacks , insomnia are more frequent than last year..
- We MUST vaccinate maximum population soon.. There is fair chance that virus will mutate in more virulant and infective form.. Vaccination is only way to prevent that from happening..
Dr Ratnadip,
Are recovered patients immune to this new strain ? Last year it was thought that immunity lasted abt 6 months.
How is it effecting small kids ?
-
sanjaykumar
- BRF Oldie
- Posts: 6865
- Joined: 16 Oct 2005 05:51
Re: Wuhan Coronavirus Resource Thread
There is no evidence at all that any gene sequencing would have/is making any difference.
Sounds impressive- gene sequencing- but as they say, how does it change management?
Sounds impressive- gene sequencing- but as they say, how does it change management?
-
DrRatnadip
- BRFite
- Posts: 604
- Joined: 31 Dec 2016 00:40
Re: Wuhan Coronavirus Resource Thread
Nobody has returned yet with reinfection in my knowledge .. So it appears that immunity is similar to other respiratory viruses.. Kids are fortunately spared yet.. I know few pts who had covid in both waves..But symptoms were very mildAtmavik wrote:DrRatnadip wrote:- There is No doubt at all that vaccines are saving lives..
- This strain is very virulant.. Some Pts die very fast .. No known intervention is able to help.. Even pregnant ladies , which were almost immune from severe disease in first wave are getting affected and even deaths are reported in them.. Mucormycosis is rising in those treated with steroids..
-Psycological issues like major depression, anxiety attacks , insomnia are more frequent than last year..
- We MUST vaccinate maximum population soon.. There is fair chance that virus will mutate in more virulant and infective form.. Vaccination is only way to prevent that from happening..
Dr Ratnadip,
Are recovered patients immune to this new strain ? Last year it was thought that immunity lasted abt 6 months.
How is it effecting small kids ?
Re: Wuhan Coronavirus Resource Thread
This virus moves too efficiently and mutates too fast with newer strains becoming more virulent.
despite the many precautions, strains are so easily carried intercontinentally.
the chinese have been eating bats and pangolins for centuries now. It is more than a little strange that an outbreak of this magnitude happens at this time
earlier they said that the virus was not airborne but now professional discussions are focussed on how long the aerosol lingers, some are saying that it may stay in aerosol form for three hours or more.
even at this stage, there are arguments about such basic transmission parameters. so how much do we really know of this lab made super spreading virus
That it came from a lab in Wuhan is not really at issue. What IS at issue is whether it was accidental or deliberate. Coinciding with Lunar New Year migration was just bad luck, or what
The very high transmissibility with targeted demographics suggests tailored virus.
So, perhaps a tailored viral genetic vector response is required.
Sir Richard Dearlove, the former head of MI6, said aspects of the virus “point in the direction of it being somewhat tailored” though he warned this may never be proven.
Re: Wuhan Coronavirus Resource Thread
It would always be of a mystery that all sorts of viruses came from china in last century but suddenly there are no virus issues within china. Do they use different quality of disinfectant than others to keep variants out? Masks only help to a certain limit and their vaccine doesn't work.
Re: Wuhan Coronavirus Resource Thread
Government of India continues to Effectively Allocate COVID -19 supplies received from the Global Community to States and UTs
Vasudhaiv Kutumbakam
Looks like no vaccine doses donated to India by any country yet.1841 Oxygen Concentrators; 1814 Oxygen Cylinders; 09 Oxygen Generation Plants; 2403 ventilators/ Bi PAP/ C PAP; more than 2.8 L Remdesivir vials delivered, so far
Vasudhaiv Kutumbakam
Re: Wuhan Coronavirus Resource Thread
Is this going across the India or just the KL? I hope that it's a system wide protocol on how to maximize something and not just specific to KL.
Narendra Modi
@narendramodi
Good to see our healthcare workers and nurses set an example in reducing vaccine wastage.
Reducing vaccine wastage is important in strengthening the fight against COVID-19.
https://mobile.twitter.com/narendramodi ... 1671260160
Re: Wuhan Coronavirus Resource Thread
Finally, someone with the knowledge of epidemiology and access to ears of higher echelon started communicating sensibly.
Save lives, and jobs: Vaccinate the young, mobile, wage-earners first
In a recent presentation to Niti Aayog, our faculty colleagues from ISB raised an alarm that vaccine supplies are limited and that it may take several months before we are able to vaccinate a significant proportion of the population. Yet, we can use principles of epidemiology and economics to schedule the rollout of vaccinations in the country.
In the current plan, the government began with vaccinating the older population first, beginning with those who were 60 years and older, followed by those who were 45 and older, and finally the population that is 18 years and older.
Understandably, this rollout plan assumes that the older population is more vulnerable to the virus and thus, must be protected. However, it ignores an important epidemiology consideration that the younger population that is more mobile is also more likely to spread the virus.
Per reports of the Union health ministry, individuals in the age group 30-50 years account for nearly 40% of cases but only 17% of deaths registered in the second wave while individuals over 50 years account for less than 30% of cases and over 80% of deaths registered in this wave. Infections in the former age group are largely asymptomatic and growing exponentially in recent weeks, leading to a very large number of cases and deaths that disproportionately affect the older, more vulnerable population.
Therefore, we would be better off vaccinating the young and the mobile population first. Priority groups could include auto and cab drivers, delivery personnel, security and medical personnel, and others who need to be out and about in the proximity of diverse individuals to earn a living to support their families.
Given that the second wave of the pandemic is more geographically clustered than the first wave – per the Lancet Covid-19 Commission task force report, the number of districts accounting for the top 75% of cases was 60-100, while it has been around 20-40 districts during this surge – it would be especially valuable to first focus on priority groups within these states and districts with the fastest rates of infection. States include Maharashtra, Chhattisgarh, Karnataka, Delhi, Tamil Nadu, Uttar Pradesh, Madhya Pradesh and Gujarat.
...
Last edited by durairaaj on 06 May 2021 21:59, edited 2 times in total.
Re: Wuhan Coronavirus Resource Thread
Govt. has to deliver - Working on it ... improving
Govt. has to cover for the slimy useless scums like Kejri - Scum has upper hand
Govt. has to communicate - Zero (NIL)
Govt. has to satisfy the milords - Going berserk
So much looting by hospital/scammers - Going on ... No one is afraid
Govt. has to cover for the slimy useless scums like Kejri - Scum has upper hand
Govt. has to communicate - Zero (NIL)
Govt. has to satisfy the milords - Going berserk
So much looting by hospital/scammers - Going on ... No one is afraid
Re: Wuhan Coronavirus Resource Thread
Young people don't fill up hospital. Older people do.
There is no point young people "working", while the hospitals are overwhelmed with sick old people. Moreover the young ones, will not be productive with their elder family members falling like flies.
ICU beds are expensive and precious asset. Pandemics eat ICU beds.
There is no point young people "working", while the hospitals are overwhelmed with sick old people. Moreover the young ones, will not be productive with their elder family members falling like flies.
ICU beds are expensive and precious asset. Pandemics eat ICU beds.
Re: Wuhan Coronavirus Resource Thread
why would theyKakkaji wrote:Government of India continues to Effectively Allocate COVID -19 supplies received from the Global Community to States and UTs
Looks like no vaccine doses donated to India by any country yet.1841 Oxygen Concentrators; 1814 Oxygen Cylinders; 09 Oxygen Generation Plants; 2403 ventilators/ Bi PAP/ C PAP; more than 2.8 L Remdesivir vials delivered, so far
Vasudhaiv Kutumbakam
lessons learned from India.
Re: Wuhan Coronavirus Resource Thread
this is just the start.vijayk wrote:Govt. has to deliver - Working on it ... improving
Govt. has to cover for the slimy useless scums like Kejri - Scum has upper hand
Govt. has to communicate - Zero (NIL)
Govt. has to satisfy the milords - Going berserk
So much looting by hospital/scammers - Going on ... No one is afraid
mumtaz and vijayan will improve on khujliwal's tactics, as will amarinder, now that the they all know that the courts are swinging only one way
Re: Wuhan Coronavirus Resource Thread
Meanwhile - Kudos to those who developed many such COVID relevant devices and GoI and DST for their support. Products and technologies developed during the first wave have already found their mark. and it is time to take head on new challenges.

Also: Reiterating summary of COVID appropriate behavior in one minute flat in the following video.
Maximum Masking (double masking or N95)
Maximum Ventilation
Maximum Distancing
Healthy Lifestyle
Positive Thoughts
Vaccination
And with these strengths, give care and help to others in whichever way we can!
Please share this: https://www.facebook.com/indiasciencetv ... 1750455314
-
S_Madhukar
- BRFite
- Posts: 1249
- Joined: 27 Mar 2019 18:15
Re: Wuhan Coronavirus Resource Thread
Did we have any regular COVID news bulletin on tv/radio etc like in the western countries while suspending regular programming ? So that the message was being hammered about precautions and all that the government is doing, and information on helplines and daily infection and death tolls etc. I think most people have access to TV or at least radio…
if this was not done then it is criminal from the I&B and health Ministry. Too much of a sab theek hai attitude..
what will these guys do in a war!
if this was not done then it is criminal from the I&B and health Ministry. Too much of a sab theek hai attitude..
what will these guys do in a war!
Re: Wuhan Coronavirus Resource Thread
Today's PIB statistics on Vaccination:
COVID-19 Vaccination Update- Day 111
COVID-19 Vaccination Update- Day 111
Numbers are heading in the right direction again. Let us see if the trend holds through the weekend. Keeping my fingers crossed.India’s Cumulative Vaccination Coverage exceeds 16.48 Cr doses
More than 2.62 lakh beneficiaries of age group 18-44 Vaccinated today till 8 pm
Nearly 23 lakh vaccine doses administered today
Re: Wuhan Coronavirus Resource Thread
The numbers this week remind me of early March. That's when >60 group began. Started slowly from the 450-500K per day they managed for the HCW/FLW group, but within three days it rose up to above 1 million and within the end of week it touched 1.5 million. That was the early sign of how much time the system takes to ramp up.
The current increase in vaccination since day 1 of the <45 vaccination is following a similar path, up almost one million per day from the rate on the first day.
The current increase in vaccination since day 1 of the <45 vaccination is following a similar path, up almost one million per day from the rate on the first day.