tenaliram wrote:@Amber G. Could I get the link to your twitter feed? I used to find your articles, analysis and links very informative and I am not sure if you have stopped posting here and only post on twitter now. Thank you in advance.
For obvious reasons I have chosen not to link my other social media posts here. I will post some of my points here. (Hope that these kind of posts don't get "poofed" by some hyper mod).
Lisa wrote:Amber G.
7 Days no post. Miss reading and getting information that helps all of us. Kindly do the necessary.
Have been very busy - among other things pouring on South Africa/US/UK detail data and talking with other scientists.
Disclaimer: I am not a medical doctor (though siblings/children/nephews/students are and I can ask them questions) so I am lookin the data through math modeling .. fortunately the fine-grain data is available and a few things we can say with fair confidence now. Still just take this points FWIW. I am responsible for the points I am making here - though most graphs here have been agreed upon by other scientists I trust.
For background - lot of my points (and vocabulary) is based on SUTRA model - just check out
A Novel Approach to Modelling Pandemics with Applications to COVID-19
Vocabulary:
(Roughly: β is contact parameter (akin/similar/related to R), ρ = is reach of pandemic, ε= ratio of tested/reported to total cases (including undetected infected). γ is taken as 0.1 ~equivalent that the infected period last for about 10 days)
-- South Africa has more or less reached the peak. As predicted long ago the peak occurred when it was predicted by the model. (It peaked on 17th December - pretty close to Sutra - prediction - (which was Dec 18-23) giving us confidence that the parameter values are reliable). This helps us to more accurately predict for other countries.

Feeding data for many countries of Europe, US and India - and seeing that model fits quite well.
(More technical details later) -
A new phase in SA - β increased from 1 to 1.35 and ρ increased from 0.86 to 1 (It is nearly 100% which means that they are loosing immunity provided earlier)
But for India and US here are the main points:
For India,
Remember India is similar to South Africa in some crucial aspects. Both have young population (about 80% population is below 45 years). Both have high natural immunity (around 80%). Last wave in both was due to Delta-mutant. Differences: SA has lower vaccine immunity than India (25% vs 40% doubly vaccinated). Vaccines used also differ (primarily Pfizer and some J&J vs Covishield and Covaxin ). SA had Beta-mutant that India did not. Omicron seems to be bypassing vaccine immunity in a major way (J&J is nearly worth-less, pfizer - fully vaccinated about 35%), and natural immunity to an extend (~18% for SA). India's figures would be similar (or we can extrapolate).
So for India we take these figures are
β ~ 0.54
ρ ~ 0.95
ε ~ 1/33
natural immunity ~ 83%.
Covidshield (from UK data) is doing poorly (but much better than J&J which is nearly ineffective along with some other vaccines like Sputnik - (More of this later in separate post)
So here is the graph - not different than the one I posted a few weeks ago.
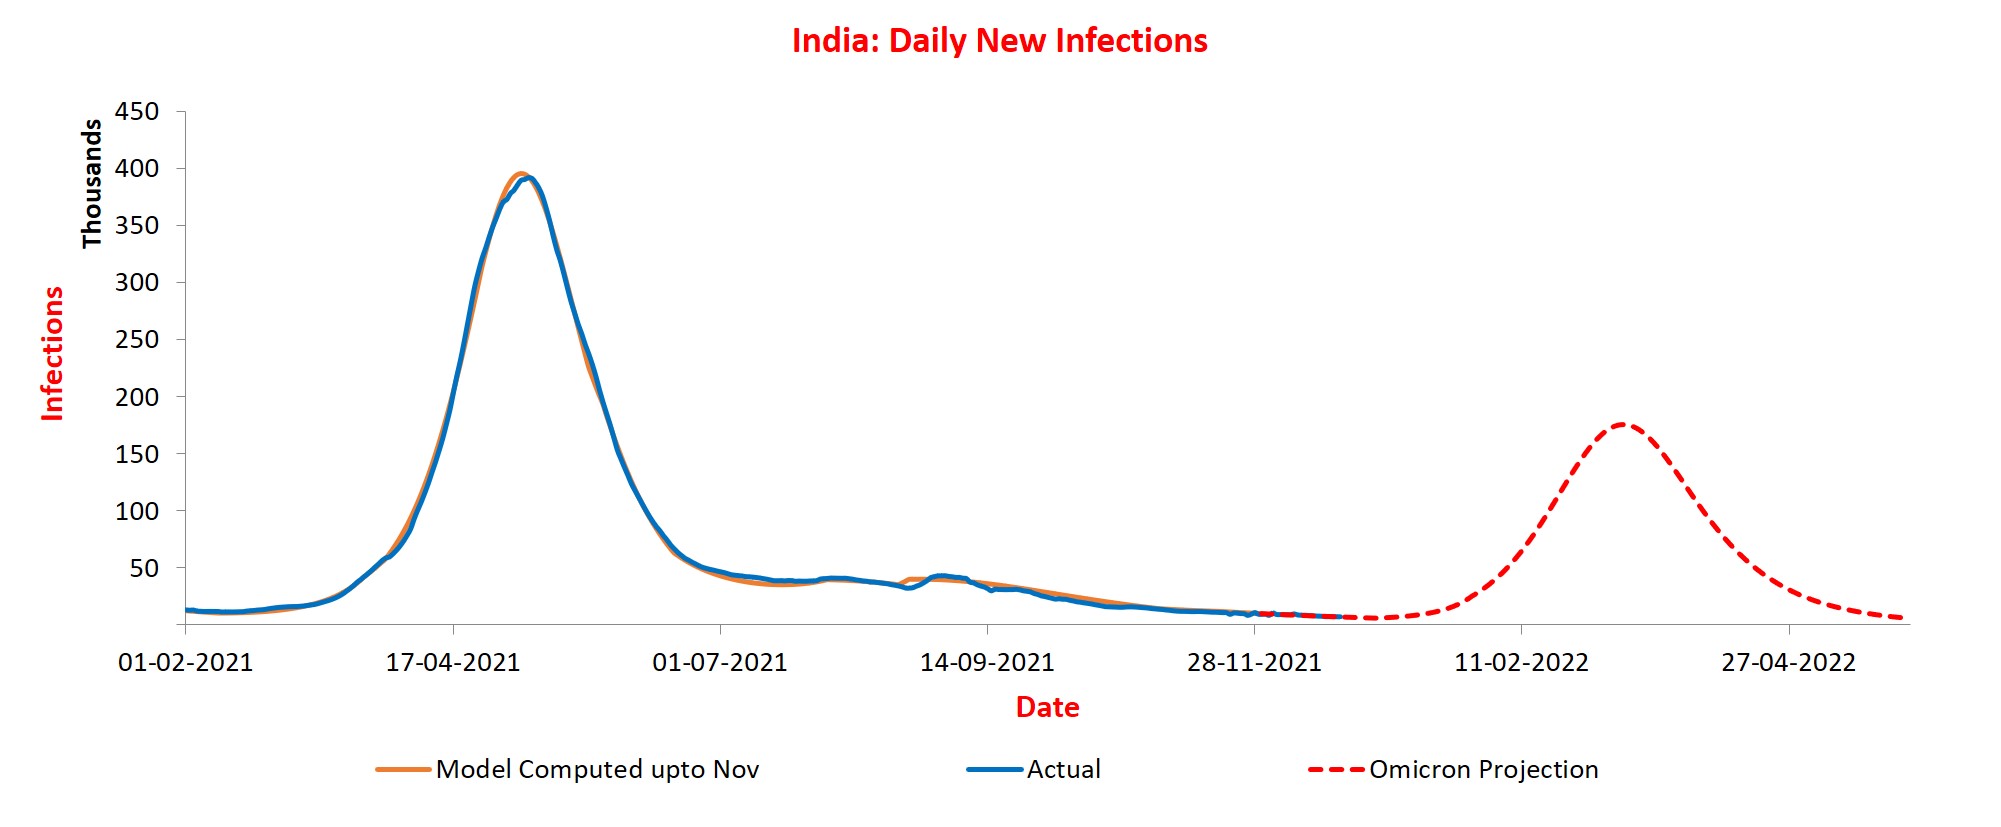
(Credit for above graph and data - SUTRA team / IITK and others)
End of February about 200,000 per day new cases. Lockdown, curfews, people using masks and massive vaccinations (Boosters/Covavax/Covaxin etc) can change the situations -- lot of crowds etc can too.
Meanwhile India seems to be okay as far as hospitalization is concerned - About 200,000 beds in mid march.
I will post similar analysis for US and some of my thoughts in separate posts.